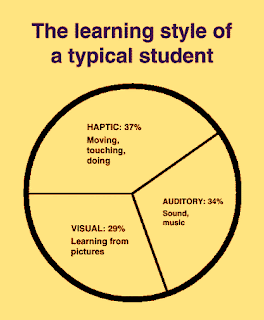
Many students in today’s generation face an acute barrier to learning. This obstacle is going largely unaddressed, despite the following conundrum:
- Most information today is delivered visually.
- Most students self-identify as visual learners.
- Many students, in fact, are not visual learners.
- Many students, therefore, are actively working (or studying) against their own educational self-interests.
Depending on
which study you believe, anywhere from 39% to 65% of people would be classified as "visual learners." Ask a roomful of children, however, what kind of learner they think they are, and almost all will claim to be visual. This is because they enjoy pictorial engagements, such as video games, television, and movies, and because image-based learning is considered to be relatively passive and thus “easier.” Two main options exist to handle this dilemma:
- Teachers can restrict visual inputs, such as laptops, iPads, smartphones and SMARTboards, to only a few select students, and, at the same time, they can rebuke children for visual proclivities and enforce more inherent auditory or kinesthetic learning styles.
- Teachers can increase instruction in visual tools.
The first choice makes little sense. It will no doubt incite insurrection, and it disregards the unavoidable future of high-retina technology. The first choice is also destructive, denying student choice, while the second option is empowering. It meets students where they are and uses the mutually acknowledged optical space as a launching pad for broader visual instruction.
Graphicacy is the literacy of decoding and encoding pictures. We've emphasized before (
here,
here, and
here) the benefits of increased graphicacy teaching in our classrooms. Infographics are
the quintessential vehicles through which to reach a visual generation. Not only are infographics omnipresent, but also they are vivid, contemporary, and
inclusive of the key elements for visual instruction.
Good infographics seamlessly blend text, images, charts, and data and, therefore, present
a ripe opportunity for
pedagoptics, a method of teaching with
optical tools.
A
recent study out of the Cornell Department of Design and Environmental Analysis used an infrared, eye-tracking system to study how people
internalize infographics. Specifically, the team mapped viewers' eye movements as they scanned infographics, recording where their eyes landed first and lingered longest. The
team found that combinations of images and text, rather than single, provocative icons, were the most effective in grabbing attention. This unexpected finding highlights the need to guide children in unraveling textual and optical data.
Marc Smiciklas, a digital strategist at
Intersection Consulting, has a new book about
The Power Of Infographics: Using Pictures To Communicate And Connect With Your Audiences. In it, he discusses the
science of visual communication. In a terrific related
blog post, Smiciklas notes that in order to negotiate information overload, the brain typically discards 99% of incoming sensory information, unless it is deemed novel or unfamiliar. He also cites
a study from Robert Lane and Dr. Stephen Kosslyn that claims visual stimuli have value based on their "
processing efficiency" and "
expressive potential." Effective images, therefore, should provide detail, lay down context, clarify complexity, and reduce learning times. Infographics neatly fit these criteria for emerging learners, especially in navigating details and enhancing learning efficiency.
The venerated image curators at
Visual.ly also recently
blogged about what made their
top 30 most-viewed infographics so popular. They analyzed the content type, content domain, design type, and use of data visualization. Their
findings offer interesting conclusions about what constitutes a potent illustration, especially in grabbing viewers' attentions.
For teaching resources, check out our library of
infographics, arranged by subject. Or check out our
graphicacy page, with more articles and research.
We also recommend these resources for further reading:


