FaME: Financial and Media Education

Throughout history, economic strength has determined the rise and fall of empires. Understanding the power of money transcends time and to some extent continues to determine the strength of nations. Yet the power of money is not the only influence on the structure of daily life. Today, the media plays an even larger role in determining who wins. Perhaps more than ever before, there is a need to be forthright in educating students in these areas, making them an integral part of the curricula. Likewise, bringing financial and media literacies into the classroom should not be viewed as separate “units of study.” Instead, they should be incorporated across all subject areas to make connections to real-life applications, especially for learners in the 21st century.

The deliberate design of information extends far beyond a combination of data and images. In fact, we see it everyday through advertising. When you think about it, every company, institution, or politician considers the selection of graphics, data, and text to market goods and services. Media of all types tell stories through branding, whether selling a war from a podium or advertising a product during a football game. For this reason, our students need the skills of analyzing and interpreting to grasp the underpinnings of finance and the messaging behind the media. They need to learn to “read an image.”

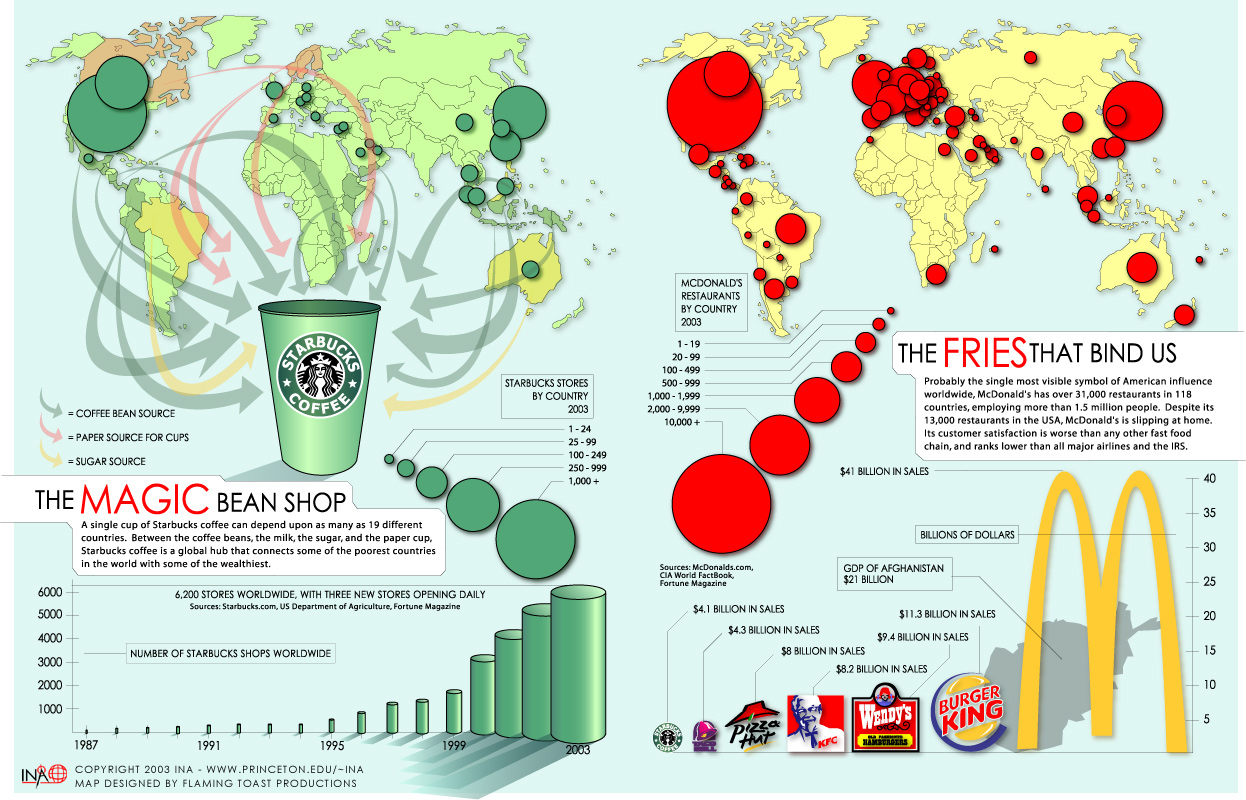
One way we do this is through visualizations such as infographics, which teach to students' interests and connect to their daily lives. For example, this Starbucks and McDonald's graphic on the Princeton University website has a clean, crisp design to compare two corporate giants:

Source: Princeton University
Although this particular infographic dates from 2003, the point about branding is clear. The financial information about McDonalds is telling, especially with the mini, built-in geography lesson comparing its nearly $32 billion in sales with the $21 billion GDP of Afghanistan. McDonald’s is a financial powerhouse in this image compared to Starbucks and other fast food competitors. Cool Infographics updated the data in 2007 showing Starbucks almost doubling the number of stores to 11,225 and McDonald's flat in terms of sales. Asking students why they think this occurred would open the discussion to changes in diet or perhaps the sheer marketing power of the Starbucks brand.

Source: gplu.com
Another good example to drill home the connection between finance and media is the infographic, "Is There a Tech Bubble?" In the fight to be number one, are financial investors willing to pay over-the-top valuations for these brands? This image would appeal to students, since social media is so much a part of their lives. It has all the key players: Facebook, LinkedIn, and Twitter. Comparing the branding and looking at the numbers can open the eyes of students to read between the hype. For this reason, using media and finance are essential in any classroom. If we stop and look around, there are countless examples for incorporating both of these literacies into everything from language arts to mathematics.

Posted in , |

Visualizing the World Population at 7 Billion


Whether the world's population reached 7 billion people as of this past Monday is still in question, but the figure is close, if not over it. According to the running tally on Breathingearth, there are still about 50 thousand more births to go. More importantly, what does this look like when we try to explain it to our students? For most of them, the concept of understanding 7 billion people is writing out the number with a lot of zeros. Even though we can demonstrate this by having students compare the number 7 to 7,000,000,000 to see the difference, to them it is just a number. They have no real connection to it.

Knowing how large the population is today does not help them understand how we got there, nor does it explain why it continues to grow. An excellent visualization to help younger students grasp population size and the reason for its sustainability is the NPR video clip below, called Visualizing How a Population Grows to 7 Billion, by Adam Cole. It is a clear and creative demonstration using the concept of water in a glass to represent continents and countries over time. Liquid filling the glass symbolizes births and leaking from the glass signifies deaths. As advances in medicine and food production take hold, the leaks slow, and eventually births begin to outnumber deaths. This simple visual representation of population growth would fit into any history, math, or geography lesson.

Posted in , , |

Doodling the News with DoodleBuzz

Arguably there are many news aggregators available today to use in the classroom, perhaps even too many, but selecting from those that have a unique way of presenting information allows students to think about the news from a different vantage point. As we mentioned in a previous post, Newsmap was one of our favorites. It helps students with the skills of decoding information based on size, frequency and proximity of events, as well as helping them learn to look at the news at a glance to make connections between currency and importance.

Created using DoodleBuzz


We recently started using another news aggregator called DoodleBuzz. This is no ordinary amalgamation of information based on a selection of criteria, organized into a pre-determined display, such as Newsmap. Although Newsmap presents the information from Google's news aggregator in an efficient, eye-catching way, it is still linear in nature. DoodleBuzz is anything but linear and bills itself as a typographic news explorer. It's designed to lead the viewer to explore information in an organic way through chance and discovery.
Created using DoodleBuzz
“You may start at Iraq but end up finishing on Britney, whilst taking in The Catholic Church, Global Warming and 50 Cent.”
Essentially, DoodleBuzz provides you with a blank canvas for drawing. To start, open DoodleBuzz, type your search term, and click go. For your results, simply doodle any shaped line you like to layout the information for your news journey. As the mouse rolls over each line in the results, the title turns red and becomes enlarged. To see an excerpt of the article, doodle a line from the title. Click on the excerpt to be taken to the original source of the full text article. Holding down the space bar lets you see your original map, and clicking toward the edges of the black square will bring back areas out of view, much like using Google maps.

The one thing to remember when using this with students is that it’s supposed to be a fun way to explore the news and not a search to a specific event. A good place to start is to give all students the same search term, but let them design the path they want to take. Invite them to share their findings as a way to demonstrate the connections they took in looking at the news.

DoodleBuzz is the dream aggregator for the visual thinker and relates to what we featured in an earlier post on learning by doodling with Sunni Brown. The process of organically taking information on a spontaneous path can lead to new discoveries and ideas. Using DoodleBuzz with students can allow them to journey through the news to make personal connections that they might not have taken if done in a more linear environment. It allows them to change the way they think about information by the sheer nature of how they draw their lines to extend their search.

Created using DoodleBuzz


Brendan Dawes is the creative designer behind DoodleBuzz. He explores the interplay of people, code, design, and art in his work. His website features an eclectic mix of digital and analog objects, including toys and projects. DoodleBuzz is also part of the recent Talk To Me exhibition at the Museum of Modern Art.

Posted in , , |

Halloween Distractions: Infographics as Literacy

Source: ANidea
As teachers, we know that Halloween is a distraction for most students, young and old, so why not turn it into a lesson using visualizations? Heck, they already have prior knowledge about the topic, even though they may not know all the facts represented in the infographics seen here. What better way to teach to their interests than to keep them glued to the blood and guts of the holiday? It is not unlike the post we did on S'Mores and other sweets that focused on candy as a universal theme to engage students. These graphics, though, have images and data about costumes, candy, pumpkins, treat-or-treating and more.

Take a look at Halloween Trends: 2011 from ANidea to find out the percentage of people attending parties or dressing up their pets. Have students locate the number of people who plan to carve pumpkins or how many billions of pounds of pumpkins are produced each year in the United States. Better yet, engage them in a little math with the number of trick-or-treaters their age or percentage of the total population.
Source: History.com
Want them to sink their teeth in a little more? Try using the infographic Halloween by the Numbers designed by History.com and Column Five or Halloween by the Numbers from Credit Donkey. Each of these provides a host of data related to the holiday rituals.
Source: Webtrends

Source: Bit Rebel
Spooky Stats Halloween Buzz from Webtrends is one more to add to the mix. Check out the hottest Halloween costumes of 2011. It looks like the Zombies have it in the classic category by 35%. Have students analyze the information in these infographics to determine and compare the differences in reporting the data. This can lead to a good discussion on checking sources and looking for conflicting information. These visualizations can lead to broader discussions about the financial and media impact on the consumer.

If you want to add a little geography and folklore to your Halloween lesson, check out Ghost-Proof Your House: 11 Ways the Superstitious Keep Evil Spirits at Bay by Colin Dobrin. This neat little infographic contains tidbits about superstitions, from not having the number of stairs divisible by three in the Philippines to building a tall spire in the northwest corner of your property in Japan to fight off evil spirits. For the older students and the not-so-sweet side of Halloween, take a look at The Darker Sides of Halloween from Bit Rebels. This infographic contains some pointed facts and numbers on Halloween crimes, pokes fun at holiday paranoia, and describes bank robbers in costume.

If nothing else, on Halloween when their attention is on candy, costumes, and getting out of school to trick-or-treat, infographics such as the ones seen here can keep them engaged in the classroom. More importantly, they provide a fun way to give students practice at analyzing visualizations to increase their skills in graphicacy, to learn a little economics, and to understand the hype behind Halloween.

Posted in , , |

Using Visual Language in the Classroom

Most teachers try to incorporate hands-on activities that invite students to use their imaginations. Sometimes these investigations involve technology, but often they rely on everyday pens and paper. If students are drawing political cartoons, diagramming maps, or decorating Greek urns, they often complain that "they're not good artists." Telling them, "it's okay, just draw stick figures," seems like a strange response from an educator. We wouldn't tell a math student, "it's okay if you're not good at multiplication, just use addition." We wouldn't tell a music student, "it's okay if you're not good at piano, just hit middle C again and again." We would ask them to try, right?

Even though we're not art teachers, we like to use visual projects in our lessons. Art is fun for children and excites the mind, so it's worthwhile to build in a few specific tools to enhance the joy of learning. Developing a common language to talk about visual literacy can be helpful in designing graphs, timelines, flowcharts, and PowerPoint slides.

Dave Gray, founder of the Visual Thinking School and writer of Communication Nation, has developed a short lesson in visual language. He offers an insightful overview of forms, fields, and flows -- the specific dots and lines that make up a picture. In a soothing voice and unassuming manner, he presents a terrific video about "the alphabet of visual language."


This basic primer in communicating through drawing has numerous benefits in daily lessons. Students can effectively generate Prezi layouts and decision boxes. They can create organizational charts, map legends, and meaningful spaces. The little skills of perspective and unity lead to larger skills of cause and effect and sequencing. Moving from the literal to the symbolic is a valuable mindset not just for art but also for math, literature, history, etc. In drawing and coloring, students are unknowingly internalizing the techniques of graphicacy.

By the way, Gray's book, "Gamestorming: A Playbook for Innovators, Rulebreakers, and Changemakers," seems like an interesting read for young entrepreneurs. Gray has experience in starting a business himself with his visual thinking firm, XPLANE.

Posted in , , |

THINK - The Imagination Age

Source: IBM, ASIDE
Leading educational thinkers have dubbed the current century the "Imagination Age," in which schools need practical approaches for teaching conceptual thinking. A project out of the University of Louisiana at Lafayette, led by Rita J. King and Joshua Fouts, has assembled a laboratory of resources and ideas to aid educators in teaching imagination. GOOD magazine notes the directors' emphasis on "a time during which humanity must imagine and then create, together, the systems of the new global economy and culture." These rich lessons and tools aim to "create the future of education and work."

Source: IBM, ASIDE
In a similar vein, the IBM THINK exhibit, celebrating creativity and innovation, ended its month-long staging at Lincoln Center in New York City on Sunday, October 23. The modestly promoted presentation honored the company's 100th anniversary by attracting curious crowds to its free, multi-sensory experience. Euro-techies and whiz kids mingled with century-savvy seniors in equal appreciation of the on-going pioneering work done with data. IBM's mesmerizing three-part showcase made for a rapt hour of education and enjoyment. It reminded us of MOMA's riveting "Talk To Me" display in its stunning visuals and enlightening facts. If you missed IBM's show, here are the take-aways:

The exhibit unfolded in three successive parts: the data wall, the immersive film, and the interactive experience.


The data wall spanned the length of Jaffe Drive beside Avery Fisher Hall. In a benched alley, visitors could absorb streaming figures and extended visuals about air pollutants, boulevard flows, world nutritions, and other animated illustrations. Live sensors around the city – and around the world – collected statistics about exhaust and traffic to relay immediately to the enormous digital display. Much like starkness and immediacy make Washington, D.C.'s Vietnam Memorial an emotional experience, so, too, did the THINK wall ask humility in the face of everyday life.
Source: IBM, ASIDE

After soaking in the graphic wall, ticket holders moved to the inside immersive film. A ten-minute broadcast flashed piecemeal on separate screens, inviting the viewer to submerge himself within distinct scenes played out on different displays. The video chronicled the impact of emerging technologies in improving life-expectancy and life-quality. Specifically, the THINK engineers emphasized five modes of thinking toward human progress:
  • Seeing
  • Mapping
  • Understanding
  • Believing
  • Acting

Source: IBM, ASIDE
Much like the new vocabulary for educators, IBM's notions are the essence of creativity. At the end of the IBM film, each panel transformed into a dynamic touch-screen, on which visitors could explore the nuances of each mode of progress. With five different types of visual interactions, people roamed the room to prod the various forms of visual mapping. They explored means of predicting wealth, weather, and viruses. Each optical panel prompted a poll for viewers to become part of the accumulation of human data.


Source: IBM, ASIDE
In all, the IBM THINK exhibit was noteworthy for its price (free), effort (considerable), and vision (progressive). The larger-than-life design of data made for captivating considerations of birth rates, agriculture, medicines, genomes, avenues, calendars, navigations, and energies. It was visual thinking in a democratic society. If every Fortune 500 company cheers its success with a similarly public commemoration, then we can applaud corporate karma.
Source: IBM, ASIDE
Source: IBM, ASIDE

For students, these lessons about the future of data usage offer thrilling conversations about energy, pollution, agriculture, and security. How to manipulate the world's mountains of information will define the nature of human progress. Teachers can nurture creativity and initiative within today's young people for them to emerge as generational leaders.

By the way, we have no affiliation with IBM. We just thought the exhibit was cool.

Posted in , , , , |

4 Ideas for Teaching about "Occupy Wall Street"

Source: NYTimes,
Seymour Chwast
With the Occupy Wall Street movement growing in global strength as it heads into its second month, our students increasingly have been asking questions about its origin and message. Since we constantly press them to pay attention to the news, it seems counter-intuitive to avoid a lesson about this particularly topical "current event."

Source: NYTimes, Triboro
We've talked before about incorporating visual analysis into current event discussions. For us, these news chats often occur on Monday mornings or after primary debates, as both students and teachers are warming up to class time and reacting to louder-than-normal headlines. For the Occupy Wall Street (OWS) protests, as with presidential elections or foreign invasions, it might be worthwhile to devote more time to a full, educational investigation. Here are four possible ways to incorporate visual methods into teaching about OWS:

Source: NYTimes,
Chermayeff & Geismar
Messaging
Many questions are being posed about the purpose of the marches or the demands of the protestors. The New York Times recently commissioned leading graphic artists and marketers to design possible logos to brand the OWS movement. We've used branding lessons before with our students as part of our media literacy curriculum. Here, the OWS events offer keen opportunities to combine media literacy with financial literacy. The two literacies lie on the same spectrum and are more closely linked than most students might realize. Integrating media and financial literacy, rather than isolating them in simplified units, helps students see connections between stock markets and corporate identities, between profit seeking and advertising. In the coming months, we will be sharing ideas about blending media and financial literacy at the annual NCSS and AMLE conferences. If you are planning to attend either of these valuable gatherings, look for our presentation, "Where Financial Literacy Meets Media Literacy: Integrate, Don’t Isolate."

Source: NYTimes, Ji Lee
With our seventh graders, we took the creative New York Times illustration and split it into individual slides. We then showed each of the logos to the students and asked which emblem they found most compelling. We first displayed the images, and then we revealed the designers' rationales. Each description offered a chance to talk about regional movements, wealth concentration, and graphic icons. The students voted that Triboro's circle logo was the best badge to capture the heart of the OWS message. Some of their comments were: "It has a hidden meaning." "I like the circles, because they're easy to recognize and anyone can draw them." "It's simple like Nike or McDonalds." "It relates to America."

Source: NYTimes,
Project Projects
Opinion
To survey popular perspectives about the OWS movement, political cartoons can offer a sampling of clever opinions (check out this earlier post about cartoons in the classroom). Daryl Cagle's Political Cartoon Index features the leading editorial cartoons each day from all major news categories. Cagle's collection of OWS cartoons presents sharp commentaries from both the pro- and anti-protester camps. In working through these drawings with students, we use four discrete steps to understand an image. These steps include: Substance, Scaffold, Story, and So What?. Our students enjoy finding cartoons in newspapers and magazines and bringing them in for our class bulletin board. Their student-initiated habit helps inspire self-motivation and visual thinking.

Primary Sources
In order to get a sense of the actual people populating the protests, we showed several photo slideshows from Zuccotti Park. Putting faces to the movement helped students identify the human side of the rallies and camp outs. It allowed students to make up their own minds about whether they supported or disdained the characters in the demonstrations. Many news sites feature high-quality photographs. C-SPAN Classroom also assembled a brief educational video vignette. These organizations each offer slightly different slideshows and interactive displays to give a sense of the activists:
Source: NYTimes, Drea Zlanabitnig

Statistics
Finally, income gaps and wealth disparities can be difficult concepts for students to internalize. Fitting today's statistics into historical lessons about the 19th-century Gilded Age or the Roaring 20s credit balloon can help put profit and debt into perspective. Also, several pages from the U.S. Census and other sources can help students view actual figures of current household earnings. This article from Yahoo! Finance's Daily Ticker, titled "The Top Five Facts about America's 1%," is a straightforward, data-driven look at the "99%" message motivating the OWS protestors. For a more visual (and opinionated) look at wealth disparity in infographics, check out these meticulously curated collections from Mother Jones, titled "It's the Inequality, Stupid" and "Who Are the 1 Percent?"

 Source: Mother Jones, Emmanuel Saez

Update: A new website, Occupy Design, aims to build "a visual language for the 99 percent."

Posted in , , , , |

Search

Swedish Greys - a WordPress theme from Nordic Themepark. Converted by LiteThemes.com.